
Salesforce Reports and Dashboards: How to Turn CRM Data Into Business Insights
Introduction
Salesforce is not only a platform for storing customer information. It also helps businesses understand their data and make informed decisions.
A company may have thousands of Leads, Accounts, Contacts, Opportunities, and Cases. Simply having this information in Salesforce is not enough. Business teams need a way to organize the information, identify trends, measure performance, and understand what is happening.
This is where Salesforce Reports and Dashboards become important.
Reports help users organize and analyze Salesforce data, while dashboards provide visual representations of important information. Together, they can help sales managers, service teams, executives, and other business users quickly understand key business metrics.
For Salesforce Administrators, Reports and Dashboards are essential skills. They are also common topics in Salesforce interviews and practical assignments.
What Is a Salesforce Report?
A Salesforce Report is a structured way of displaying and analyzing records stored in Salesforce.
For example, a sales manager might want to know:
How many Leads were created this month?
Which Opportunities are currently open?
Which sales representatives have the highest pipeline?
How many Cases are still unresolved?
Which Accounts generated the most revenue?
A Report can organize the relevant Salesforce data to answer these questions.
Why Are Salesforce Reports Important?
Reports can help organizations:
Analyze business data
Track performance
Identify trends
Monitor sales pipelines
Review customer-service activity
Support decision-making
Find incomplete or incorrect information
Instead of manually checking hundreds of records, users can create a report that presents the required information in an organized format.
What Is a Salesforce Dashboard?
A Salesforce Dashboard displays information visually.
Instead of looking at rows of records, users can see charts, graphs, metrics, and other visual components.
For example, a Sales Dashboard could show:
Total Sales
Open Opportunities
Pipeline by Sales Representative
Monthly Revenue
Opportunities by Stage
Dashboards can make important information easier to understand at a glance.
Reports vs Dashboards
A common Salesforce interview question is:
What is the difference between a Report and a Dashboard?
The simple explanation is:
Report
A Report primarily presents and analyzes Salesforce data in a structured format.
Dashboard
A Dashboard visually represents data, often using reports as its underlying source.
Think of it this way:
Report → Detailed Data
Dashboard → Visual Summary
Types of Salesforce Reports
Salesforce provides different report formats for different requirements.
The major report types include:
Tabular Reports
Summary Reports
Matrix Reports
Joined Reports
Understanding these formats is important for Salesforce Administrators.
1. Tabular Reports
Tabular Reports display records in rows and columns.
They are useful when you simply need a list of records.
Example
A company wants a list of all open Leads.
The report could display:
Lead Name Company Status Owner
Rahul Sharma ABC Ltd Open Amit
Priya Singh XYZ Pvt Ltd Working Neha
Tabular reports are simple and useful for straightforward lists.
2. Summary Reports
Summary Reports allow users to group data and summarize information.
For example, a sales manager could group Opportunities by:
Sales Representative
and calculate:
Total Opportunity Amount
This makes Summary Reports useful for business analysis.
3. Matrix Reports
Matrix Reports allow data to be grouped by both rows and columns.
For example, a business might want to analyze sales:
By Product
and
By Region
This creates a two-dimensional view of the information.
Matrix Reports can be useful when users need to compare multiple dimensions.
4. Joined Reports
Joined Reports can combine multiple report blocks into one report.
For example, a sales manager may want to analyze:
Leads
Opportunities
Cases
within a single report.
Joined Reports can provide a broader view when information from different report types needs to be analyzed together.
Understanding Report Filters
Filters are an important part of Salesforce Reports.
They allow you to control which records appear in a report.
For example:
Show Opportunities where:
Stage = Open
Amount > a specified value
Close Date = Current Month
Without appropriate filters, a report may contain too much information.
Example: Monthly Sales Report
Suppose a company wants to see Opportunities expected to close this month.
The Administrator can create filters based on:
Close Date
and
Opportunity Status/Stage
The resulting report can help the sales team focus on relevant Opportunities.
Report Grouping
Grouping allows users to organize report results.
For example, Opportunities can be grouped by:
Stage
Owner
Industry
Region
Account
Grouping is particularly useful when managers want to compare performance across categories.
Summary Information
Reports can provide calculations such as:
Sum
Average
Minimum
Maximum
Record Count
For example, a manager may want to know:
Total Opportunity Amount
rather than reviewing every individual Opportunity.
Creating a Salesforce Dashboard
Once useful reports are available, they can support dashboard visualizations.
A dashboard might include:
Component 1
Total Sales
Component 2
Opportunities by Stage
Component 3
Sales by Region
Component 4
Lead Conversion
Component 5
Cases by Priority
This gives management a quick overview of business activity.
Common Dashboard Components
Salesforce dashboards can use different visual representations.
Depending on the requirement, users can display information using components such as:
Charts
Tables
Metrics
Gauges
Other supported dashboard visualizations
The goal is to choose a visualization that makes the underlying information easier to understand.
Practical Example: Sales Dashboard
Imagine a company has a sales team of 20 employees.
The Sales Manager wants to monitor performance.
A dashboard could include:
Total Pipeline
Closed-Won Opportunities
Open Opportunities
Sales by Representative
Sales by Region
Monthly Performance
Instead of opening multiple reports separately, the manager can use the dashboard for a quick overview.
Practical Example: Customer Service Dashboard
Reports and dashboards aren’t limited to sales.
A Customer Service Dashboard could display:
Open Cases
Closed Cases
Cases by Priority
Cases by Support Agent
Average Resolution Metrics
Cases by Category
This can help service managers identify areas that need attention.
Reports and Dashboards for Management
Executives often don’t need to review every individual record.
They need answers to questions such as:
Are sales increasing?
Which region is performing best?
How many high-value Opportunities are open?
How many customer Cases are unresolved?
Are teams meeting their targets?
Well-designed reports and dashboards can present these insights quickly.
Report Folders
Reports need to be organized so that users can find them easily.
Organizations can use folders to organize reports based on:
Department
Team
Function
Purpose
For example:
Sales Reports
Service Reports
Management Reports
Marketing Reports
Good organization becomes increasingly important as the number of reports grows.
Report Access and Security
Reports contain business information, so access should be managed appropriately.
Not every employee should necessarily have access to every report.
Administrators should consider:
Folder access
User permissions
Record-level security
Report visibility
A report cannot simply be considered “safe” because it only displays data. Its underlying records and user access still matter.
Common Mistakes Beginners Make
Creating Too Many Reports
Before creating a new report, check whether an existing report can be modified.
Using Poor Filters
Incorrect filters can produce misleading results.
Making Dashboards Too Complicated
A dashboard should make information easier to understand, not harder.
Ignoring User Requirements
Always ask what decision the report is supposed to support.
Not Testing Results
Verify that the report is showing the expected records.
How to Practice Salesforce Reports and Dashboards
You can build a practice Salesforce organization with sample data and create projects.
Project 1: Sales Report
Create a report showing open Opportunities.
Project 2: Lead Report
Show Leads by status and source.
Project 3: Sales Dashboard
Display:
Total Pipeline
Opportunities by Stage
Sales by Owner
Project 4: Customer Service Dashboard
Display:
Open Cases
Cases by Priority
Cases by Owner
These projects can help beginners understand how reporting works in real business scenarios.
Salesforce Reports and Dashboards in Interviews
Salesforce interviewers may ask:
What is a Report?
Explain how it is used to organize and analyze Salesforce records.
What are the types of Reports?
Know Tabular, Summary, Matrix, and Joined Reports.
What is a Dashboard?
Explain how it provides a visual representation of business data.
What is the difference between a Report and Dashboard?
Explain detailed analysis versus visual presentation.
What are Report Filters?
Explain how filters determine which records appear.
What is Report Grouping?
Explain how records can be organized into categories.
A Simple Learning Roadmap
If you’re new to Salesforce reporting, follow this order:
Step 1
Understand Salesforce objects and records.
Step 2
Learn Report Types.
Step 3
Create simple Tabular Reports.
Step 4
Practice filters.
Step 5
Learn grouping and summaries.
Step 6
Create Matrix and Joined Reports.
Step 7
Build dashboards.
Step 8
Create complete business reporting projects.
Step 9
Practice interview scenarios.
This progression can help you develop practical reporting skills.
Why Reports and Dashboards Matter for Salesforce Administrators
Salesforce Administrators often act as a bridge between Salesforce technology and business teams.
A manager may say:
“I want to know which sales representatives have the highest open pipeline.”
The Administrator needs to translate that requirement into a useful report or dashboard.
This means the Administrator needs both:
Salesforce Knowledge + Business Understanding
That combination is important for a successful Salesforce career.
Why Choose Prabh Kirpa Classes?
At Prabh Kirpa Classes, learners can develop Salesforce skills through structured training, practical assignments, projects, and career preparation.
Training areas include:
Salesforce Administration
Reports and Dashboards
Flow Builder
Data Management
Salesforce Development
Apex
SOQL
Lightning Web Components
Salesforce Integration
OmniStudio
Practical Projects
Certification Guidance
Resume Preparation
Mock Interviews
Job Support
The focus is on helping learners understand Salesforce concepts and apply them to practical business requirements.
Frequently Asked Questions
Are Salesforce Reports difficult to learn?
The basics are relatively straightforward once you understand Salesforce objects, fields, records, filters, and relationships.
Can beginners learn Salesforce Dashboards?
Yes. Beginners can start by creating simple reports and then convert useful report information into dashboard components.
Are Reports and Dashboards important for Salesforce Admin jobs?
Yes. Reporting and dashboards are important Salesforce Administration skills because businesses rely on data to monitor performance and make decisions.
What should I learn before Reports and Dashboards?
Start with Salesforce fundamentals, objects, fields, relationships, and basic data management.
Can Reports and Dashboards help in interviews?
Yes. They are common practical Salesforce topics and can appear in both conceptual and scenario-based interviews.
Conclusion
Salesforce Reports and Dashboards help organizations transform CRM data into useful business information. Reports allow users to organize, filter, group, and analyze records, while dashboards provide visual summaries that make important information easier to understand.
For Salesforce beginners, reporting is an excellent practical skill to develop. Start with simple reports, learn filters and grouping, then move toward dashboards and complete business projects.
At Prabh Kirpa Classes, learners can build Salesforce Administration, Reporting, Flow, Development, Integration, and other practical skills through structured training, projects, certification guidance, interview preparation, and job support.
Learn Salesforce. Understand the data. Turn information into better decisions.
Newsletter
Recent Posts
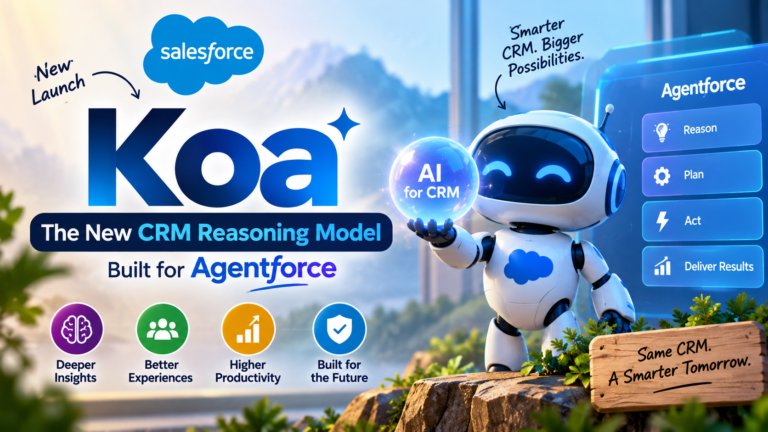
Salesforce Koa: The New CRM Reasoning Model Built for Agentforce
Artificial intelligence is rapidly changing how businesses use CRM platforms.

Asian Games 2026: Manu Bhaker & Pawan Sehrawat India’s Flag-Bearers | Current Affairs MCQ
In today’s Current Affairs 2026 MCQ, we cover an important
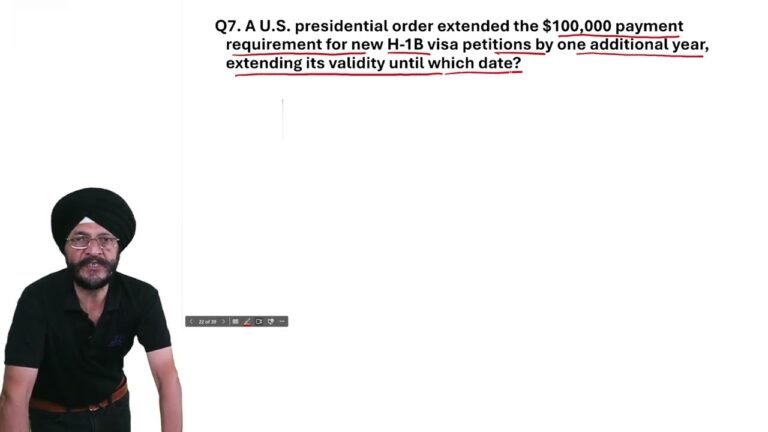
Trump Extends $100,000 H-1B Payment Requirement Till September 21, 2027 | Current Affairs 2026
In today’s Current Affairs 2026 MCQ, we cover an important

Bill Gates Backs Climate Startups to Cut Cattle Methane Emissions | Current Affairs 2026
In today’s Current Affairs 2026 MCQ, we cover an important